

Whether you're building web applications, mobile applications, or something else entirely, performance and scalability go hand in hand. You can expect a system that scales poorly to eventually be outperformed and replaced by a competing system that scales well. So, how do you ensure the longevity of your software system? The first step is to find out where in your software architecture your performance is being throttled.
This article will go over the basics of performance testing, common performance bottlenecks, and some strategies and tools for finding bottlenecks. We'll also sprinkle in some questions to help you test your knowledge. Afterward, we'll wrap up with some resources to check out if you want to learn more about some similar topics.
Let's dive right in!
We'll cover:
- What is performance testing?
- The performance testing process
- Automated performance testing tools
- Bonus Section: Profiling
- Wrapping up and next steps
What is performance testing?
Performance testing is primarily concerned with testing a system or application to ensure that it maintains its performance under increased load and edge conditions. Performance testing is typically handled by a quality assurance (QA) team or by your development and operations (DevOps) team.
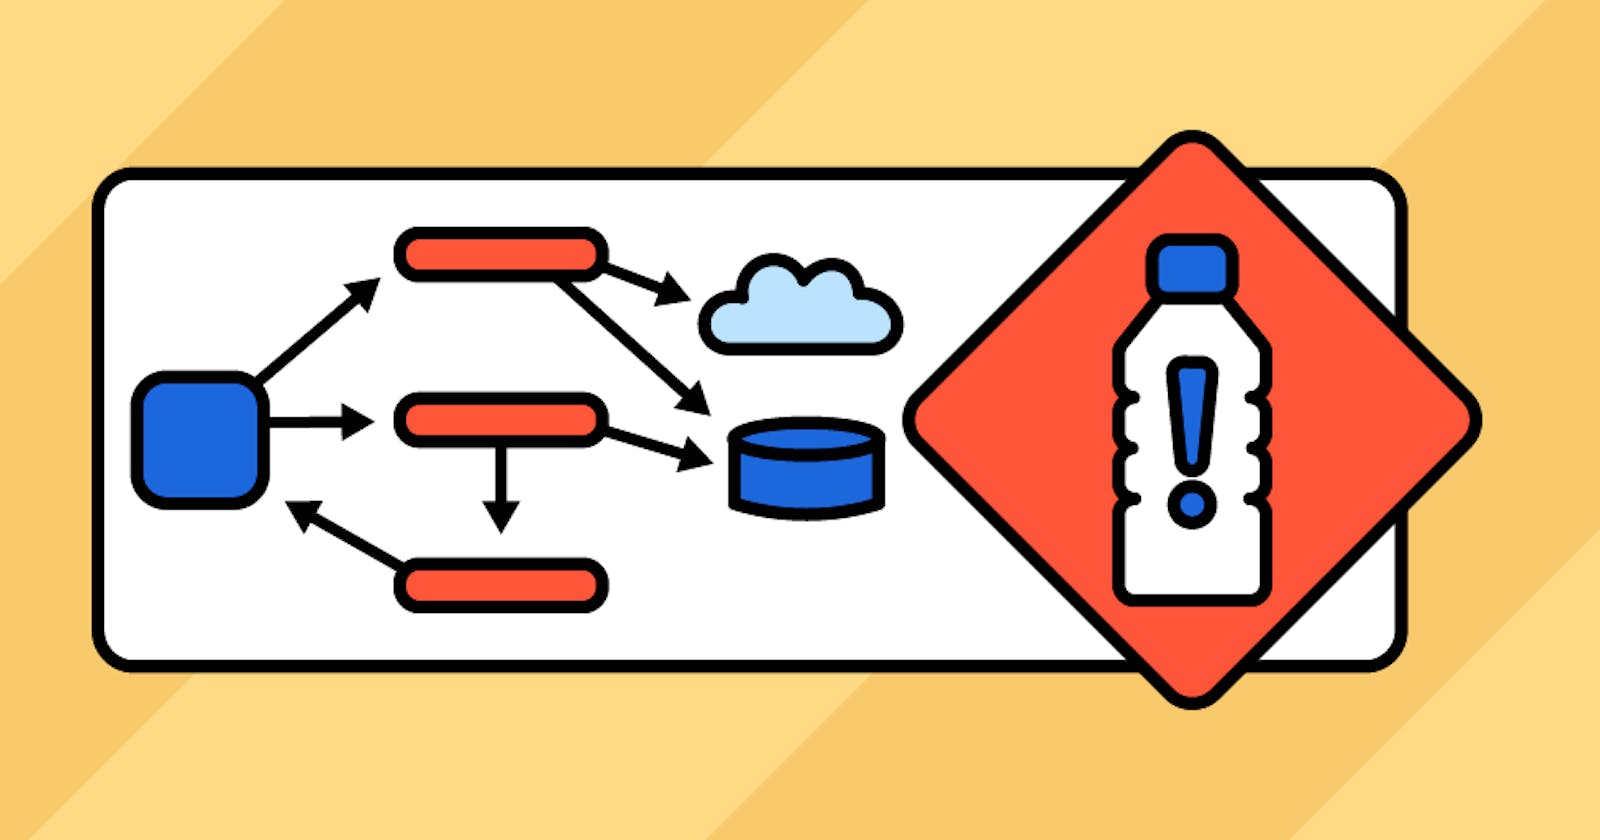
Performance testing is less about finding bugs in the software and more about identifying and removing performance bottlenecks. Bottlenecks are individual points that limit an application’s performance. These bottlenecks are usually due to inappropriate architecture, poor hardware choices, or faulty implementations.
“I say an hour lost at a bottleneck is an hour out of the entire system. I say an hour saved at a non-bottleneck is worthless. Bottlenecks govern both throughput and inventory.”
Eliyahu M. Goldratt
Why is performance testing necessary?
Without performance testing, your system can suffer from slow runtimes, poor scalability, prolonged response times, and other inconsistencies that contribute to a negative user experience.
A system that runs sub-optimally or is prone to failures will eventually need to resolve those issues. Performance testing is necessary, and it’s also something that you should be doing regularly for each build to make sure that your system runs reliably. Even short periods of downtime can be costly.
Performance testing can demonstrate that a system meets a standard of performance or as a comparison between two systems to see which one performs better.
Attributes of a performant system
Reliability: “How consistently does this system perform under various conditions?” Scalability: “What is the maximum workload or user load that this system can handle?” Speed: “How fast is this system running?” Stability: “Is this system resilient to failure in different conditions?”
Types of performance testing
- Stress testing places a system under an extreme workload to determine the point at which the app will crash
- Load testing measures the response time of a system under typical workloads
- Spike testing places a system under rapidly changing workloads to see how it performs
- Endurance testing exposes a system to a specific workload level for an extended period of time to see how long it can sustain performance
- Volume testing checks to see how efficiently a system can process varying database volumes
- Scalability testing gradually increases the workload to see how efficiently a system can scale up to maintain its performance
Scalability Thought Exercise
How many end-users will your application need to support at release?
Now, think about how many users it'll need to support a year or two from then.
Key performance indicators (KPIs)
These are some common metrics used for performance testing.
- Requests per second (RPS): The rate of requests per second that are received, processed and responded to by a system
- Throughput or Transactions per second (TPS): The rate of transactions completed by a system
- Availability: The amount of time that an application is available to an end-user Processor usage: The amount of time spent by the processor to execute a request
- Memory usage: The amount of physical memory utilized to execute a request
- Latency: Amount of time between a user request and the start of a system’s response
- Bandwidth: The number of bits per second flowing through a network connection in a given time
- Response time: The amount of time it takes for an application to respond to a user request once it arrives
- CPU interruptions per second: The average number of hardware interrupts that a process receives
- Other: Error rate, average load time, private bytes, hit ratios, committed memory, top waits, page faults, maximum active sessions
The performance testing process
Performance testing methodologies can vary depending on your specific needs, but for the most part, they tend to follow the same basic steps.
Step 1: Identify your testing environment
Ideally, you'll want to be able to choose an appropriate performance testing tool and testing environment. If you don't have control over these factors, you'll want to know as much as you can about your testing environment before designing tests. During this stage, you'll need to identify relevant information related to the:
- Performance testing environment
- Deployment environment
- Available testing tools
- Hardware, software, and network configurations
Knowing what environment you'll be working in and what tools will be available will help you identify potential roadblocks before testing begins.
Step 2: Identify your KPIs and performance targets
Next, you'll want to identify which key performance indicators will provide the information you need. You will also need to identify realistic benchmarks, constraints, and other performance-related criteria.
At this stage, you should be thinking about what "good performance" actually means for your application. There isn't an industry-standard definition of what good performance entails, so you'll have to base your goals around what good performance would look like from the perspective of your end-users.
Here are some questions to consider when defining your KPI benchmarks:
- What are the conditions or constraints of this test?
- What is an acceptable result for this KPI?
- What is an unacceptable result for this KPI?
- What is the goal for this KPI?
Step 3: Plan and design your performance test
In this phase, you'll be thinking about how usage may vary among end users, as well as typical use cases. Consider different scenarios that reflect real-world platform traffic and traffic spike conditions, and then design your tests to examine how a system performs in these situations.
Then, create a plan for how the performance testing will take place. Once relevant stakeholders have approved the proposed method and designs, you can move on to configuring the test environment and script development.
Step 4: Configure your testing environment
During this stage, you or your business should configure and prepare any tools or resources needed to perform the test.
Ideally, your performance test environment would be a 1:1 mirror of the deployment environment, but that's often impractical due to the cost and complexity required to reproduce your server content and architecture.
In general, you do want to make sure that the number of application tiers in your performance testing environment is identical to the live tier deployment model. It's also better if the size of the application database is a close approximation of the live one.
Step 5: Implement your designs
Develop and test your performance test. You want to run a pilot test to check and see if your performance test can measure the targeted KPIs.
Step 6: Run your performance tests
You can now execute your performance tests. During the performance tests, you will be monitoring and recording performance data.
Step 7: Analyze findings, report test results, and retest
Once you're done gathering performance data, you can start analyzing it and identify different ways to improve platform performance.
The results are the most critical deliverable for performance testing. Create a descriptive and concise test report. Share your findings with the developers, along with any recommended solutions. Then, retest!
Automated performance testing tools
Whether you're testing in-house or working for a client, you'll need to select and use a testing tool that is compatible with the application you're testing. This is an important step that is often overlooked and can lead to unnecessary problems down the road.
Here are some of the most popular performance testing tools used today.
LoadRunner Professional and LoadRunner Cloud
LoadRunner is a highly efficient industry-standard performance testing tool that supports performance for Windows, Mac, and web-based applications. It specializes in finding bottlenecks before the application is implemented or deployed. LoadRunner can be a somewhat costly tool to use but comes with a slew of features.
Key features:
- Great for handling a large number of users when testing
- Supports cloud testing
- Supports mobile testing
- Interactive user transaction simulation
- Continuous rigorous testing
- Advanced forecasting features
- Supports testing on a wide range of applications
LoadRunner supports the following integrations:
- Jenkins
- DynaTrace
- UFT
- SiteScope
- AppDynamics
- Selenium
- HP Diagnostics
- Microsoft Visual Studio
WebLOAD
WebLOAD is a flexible performance testing tool that would be a solid choice for small, medium, and large enterprises. WebLOAD is capable of simulating hundreds of thousands of concurrent users.
Key features:
- One of the best testing tools for stress and load testing
- Includes an IDE with a wide range of tools including response validation, parameterization, messaging, and more
- Scripts can be run dynamically and on different virtual clients
- Provides a detailed rundown of collected data
It also provides the following integrations:
- Jenkins
- AppDynamics
- Selenium
- DynaTrace
- Amazon Web Dynamics
- New Relic
- Perfecto Mobile
Apache JMeter
JMeter is a popular open-source load and performance testing tool. It supports various applications, servers, and protocols, including HTTP, TCP, SOAP, Web, LDAP, etc. It is one of the most popular performance testing tools available but is less efficient at detecting threats in large-scale applications than in small applications.
Key features:
- Extreme versatility
- Dynamic and static testing resources
- Fast and intuitive GUI
- Plugin architecture makes it highly extensible
- 100% Java scripted
- Multithreading framework
- Free!
JMeter is compatible with the following integrations:
- Microsoft Visual Studio
- Maven
- BlazeMeter
- DynaTrace
- Jenkins
- CloudGen
- JSUnit
- Meliora TestLab
Bonus: Profiling
Your program runs, software bugs have been addressed, and the internal logic of the program is solid. However, your program is just not performing as well as it needs to for some reason. Software systems can be complex, and that complexity tends to scale as a company grows. Where complexity abounds, so do performance bottlenecks.
A software system can become so complex that the source of these bottlenecks can become obscured to even the most experienced engineers. Luckily, profiling can make it much easier to locate bottlenecks.
Performance testing is most often a proactive measure to address bottlenecks and other performance issues in your application. On the other hand, profiling is a reactive measure that helps finetune the performance testing process.
If your test data shows a problem with your system, you need to find out where that performance problem is. Finding out where a system is running slow is difficult, especially for modern applications with hundreds of thousands of lines of code and numerous components.
Profilers help programmers see which sections of a program use up the most time and resources. Profilers measure the duration and frequency of function calls while considering the time complexity and available memory of a program. If performance issues occur, be prepared to diagnose the issue with a profiling tool like Prefix or Scalene before jumping into optimization.
"Rushing to optimize before the bottlenecks are known may be the only error to have ruined more designs than feature creep."
Eric S. Raymond
Check out the original post on the Educative blog to practice with an interactive quiz embedded in the article!
Wrapping up and next steps
By now you should have a rough idea of what performance testing entails, and why it can be helpful for software development. Thinking about system performance can get you to consider a solution’s reliability, robustness, ease of maintenance, and potential for scalability. So, if you’re just starting your journey to becoming a software engineer, or are considering a career in DevOps, you’re already ahead of the game!
To continue learning about these concepts and more, check out this Educative course on Performance Test Automation 101.
Happy learning!
Continue learning about testing on Educative
- Software testing 101: Get started with software testing types
- Performance testing tutorial: Automation, Gatling, and Jenkins
- All about unit testing: 11 best practices and overview
Start a discussion
What else are you hoping to learn about system design? Was this article helpful? Let us know in the comments below!